

Every dollar spent on advertising should work harder for your business. Yet many companies struggle to determine whether their ad campaigns are truly profitable or simply burning through their marketing budget.
Return on Ad Spend (ROAS) has become the gold standard for measuring advertising effectiveness across digital marketing channels. This metric helps businesses understand exactly how much revenue each advertising dollar generates, making it essential for optimizing campaign performance and maximizing profitability.
Understanding what constitutes a good ROAS can mean the difference between scaling successful campaigns and wasting resources on underperforming ads. Different industries, platforms, and business models require different ROAS benchmarks, and knowing these nuances will help you set realistic goals and make data-driven decisions.
This comprehensive guide will walk you through everything you need to know about ROAS, from basic calculations to advanced optimization strategies, helping you transform your advertising investments into measurable business growth.
Understanding ROAS: The Foundation of Ad Performance
ROAS measures the revenue generated for every dollar spent on advertising. Unlike broader business metrics, ROAS focuses specifically on the direct relationship between ad spend and the revenue it produces, making it invaluable for campaign optimization and budget allocation.
The importance of ROAS in evaluating advertising effectiveness cannot be overstated. This metric provides immediate feedback on campaign performance, allowing marketers to identify winning strategies and eliminate wasteful spending. ROAS data helps businesses make informed decisions about scaling campaigns, adjusting targeting, and optimizing creative elements.
Many marketers confuse ROAS with Return on Investment (ROI), but these metrics serve different purposes. While ROI considers all costs associated with an investment including overhead and operational expenses, ROAS focuses exclusively on the relationship between advertising spend and generated revenue. ROI provides a broader business perspective, while ROAS offers specific insights into advertising performance.
Calculating ROAS: The Formula and Examples
The ROAS calculation is straightforward: (Revenue from Ads ÷ Cost of Ads) × 100. This formula gives you a percentage that represents how much revenue each advertising dollar generates.
Here’s a step-by-step guide with practical examples:
Step 1: Identify your total advertising spend for a specific period or campaign.
Step 2: Calculate the revenue directly attributed to those ads.
Step 3: Apply the formula and interpret your results.
Let’s examine some real-world scenarios:
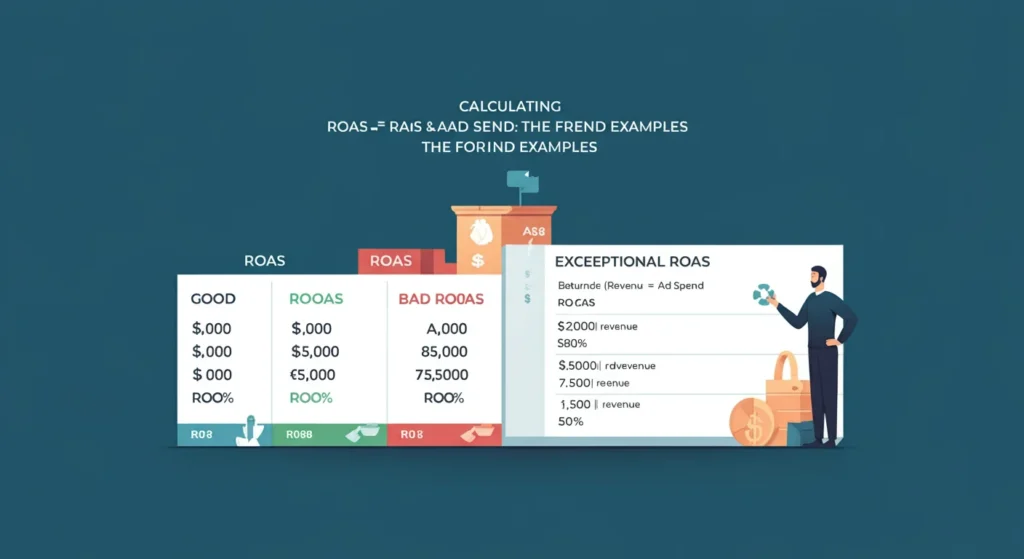
Good ROAS Example (E-commerce): An e-commerce company spends $5,000 on Google Ads and generates $25,000 in revenue. ROAS = ($25,000 ÷ $5,000) × 100 = 500%. This strong ROAS indicates the ads are highly effective, generating $5 for every dollar spent.
Bad ROAS Example (E-commerce): An e-commerce company spends $10,000 on Facebook Ads and generates $8,000 in revenue. ROAS = ($8,000 ÷ $10,000) × 100 = 80%. This poor ROAS shows the ads are unprofitable, returning only 80 cents for every dollar invested.
Exceptional ROAS Example: FinanceCore AI spends $2,000 on LinkedIn Ads targeting financial professionals and secures three new enterprise clients, each with an annual contract value of $50,000. Total revenue = $150,000. ROAS = ($150,000 ÷ $2,000) × 100 = 7,500%. This exceptional ROAS highlights the effectiveness of targeted, high-value client acquisition.
Poor ROAS Example: FinanceCore AI spends $3,000 on general display ads and generates $1,500 in revenue. ROAS = ($1,500 ÷ $3,000) × 100 = 50%. This very low ROAS suggests that broad, untargeted advertising is ineffective for this business model.
Common pitfalls include failing to track all revenue sources, incorrectly attributing organic sales to paid campaigns, and not accounting for delayed conversions. Avoid these issues by implementing proper tracking systems and understanding your customer journey.
Industry Benchmarks for ROAS
General ROAS benchmarks vary significantly across industries due to differences in profit margins, customer acquisition costs, and competitive landscapes. Most successful businesses aim for a minimum ROAS of 300-400%, meaning they generate $3-4 in revenue for every dollar spent on advertising.
What Is a Good ROAS for E-commerce?
E-commerce businesses typically target a ROAS of 400-600%, though this varies based on product categories and profit margins. Fashion retailers might accept lower ROAS due to higher volume potential, while luxury goods often require higher ROAS to justify advertising spend.
Several factors affect e-commerce ROAS including product pricing, shipping costs, return policies, and seasonal demand fluctuations. Businesses selling high-margin products can operate with lower ROAS targets, while those with thin margins need higher ROAS to maintain profitability.
What Is a Good ROAS for Facebook Ads?
Facebook Ads generally perform well with a ROAS of 300-500%, though this depends heavily on industry and targeting precision. The platform’s sophisticated targeting capabilities can deliver exceptional results when properly configured.
Facebook ROAS is influenced by audience quality, creative performance, bidding strategy, and campaign objectives. Video content often achieves higher engagement and better ROAS compared to static images, while lookalike audiences frequently outperform interest-based targeting.
What Is a Good ROAS on Amazon?
Amazon advertising typically sees ROAS ranges of 300-800%, with established brands often achieving higher returns due to better conversion rates and customer trust. Amazon’s high-intent environment generally produces strong ROAS performance.
Amazon ROAS factors include product reviews, pricing competitiveness, inventory management, and keyword relevance. Products with numerous positive reviews and competitive pricing typically achieve better ROAS than newer or poorly-reviewed items.
Factors Influencing ROAS
Industry-specific factors play a crucial role in determining achievable ROAS levels. Software companies often see higher ROAS due to recurring revenue models, while retailers face pressure from inventory costs and shipping expenses. Understanding your industry’s unique characteristics helps set realistic expectations.
Competition intensity directly impacts ROAS performance. Highly competitive markets typically require higher advertising spend to maintain visibility, potentially reducing ROAS. Markets with less competition often allow for better ROAS performance due to lower cost-per-click rates.
Ad quality significantly affects ROAS through its impact on relevance scores and user engagement. Well-crafted ads with compelling headlines, clear value propositions, and strong calls-to-action typically achieve better ROAS than generic or poorly-designed advertisements.
Targeting precision influences ROAS by ensuring ads reach users most likely to convert. Broad targeting often results in lower ROAS due to wasted impressions, while highly-focused targeting can dramatically improve performance by reaching qualified prospects.
Seasonality and promotional periods create fluctuations in ROAS performance. Holiday shopping seasons typically boost e-commerce ROAS, while B2B companies might see better performance during specific industry events or budget cycles. Understanding these patterns helps optimize campaign timing and budget allocation.
Strategies to Improve ROAS
Ad optimization begins with compelling copy and engaging creatives that resonate with your target audience. Test different headlines, descriptions, and visual elements to identify combinations that drive the highest conversion rates. A/B testing reveals which messages perform best with your specific audience.
Targeting refinement involves analyzing audience data to identify the most profitable segments. Use demographic information, behavioral data, and conversion history to create highly-focused audience groups. Exclude audiences that consistently underperform to prevent budget waste.
Landing page optimization ensures that ad traffic converts effectively once it reaches your website. Page load speed, mobile responsiveness, clear value propositions, and streamlined checkout processes all impact conversion rates and overall ROAS performance.
Bidding strategies can significantly impact ROAS by optimizing how you compete for ad placements. Automated bidding options like target ROAS bidding can help maintain consistent performance, while manual bidding provides greater control over specific audience segments.
Continuous A/B testing enables ongoing performance improvements by systematically comparing different approaches. Test ad copy variations, targeting options, bidding strategies, and landing page elements to identify optimization opportunities and maintain competitive performance.
Limitations of ROAS
ROAS doesn’t account for gross profit, calculating revenue generated from ad spend without considering the cost of goods sold or operational expenses. This limitation provides an incomplete picture of actual profitability, potentially misleading businesses about campaign effectiveness.
The metric ignores Customer Lifetime Value (CLTV), focusing on immediate revenue while overlooking the potential long-term value of acquired customers. High ROAS can be misleading if customer retention is poor, making the initial acquisition less valuable over time.
Attribution challenges complicate ROAS accuracy since the metric assumes direct attribution of revenue to ad spend. Complex customer journeys involving multiple touchpoints can make it difficult to accurately credit specific ads with resulting sales, potentially oversimplifying advertising impact.
External factors like seasonality, market trends, and competitive activities significantly influence advertising performance and revenue but aren’t reflected in ROAS calculations. These factors can skew results and make period-to-period comparisons less meaningful.
ROAS provides limited scope by measuring only ad performance without capturing broader marketing impacts such as brand building, customer engagement, and market positioning. These intangible benefits contribute to long-term business success but don’t appear in ROAS calculations.
Cross-channel analysis becomes challenging when using ROAS due to variations in cost structures, attribution models, and customer behavior across different advertising platforms. This difficulty makes it harder to optimize overall marketing spend effectively across multiple channels.
Alternative Metrics for Comprehensive Analysis
Gross Profit measures revenue after deducting the cost of goods sold, providing a clearer picture of actual profitability than ROAS alone. This metric helps businesses understand whether their advertising generates genuine profit rather than just revenue.
Customer Lifetime Value (CLTV) estimates the total revenue a customer will generate throughout their relationship with your business. Combining CLTV with ROAS helps assess the long-term value of advertising investments and justifies higher acquisition costs for valuable customers.
Return on Investment (ROI) considers all costs associated with advertising campaigns, including operational expenses and overhead costs, to evaluate overall profitability. ROI provides a more comprehensive financial perspective than ROAS.
Cost Per Acquisition (CPA) measures the cost of acquiring new customers through advertising, making it useful for optimizing ad spend and targeting strategies. CPA works particularly well when combined with CLTV to evaluate acquisition efficiency.
Attribution Modeling analyzes different touchpoints in a customer’s journey to understand how each interaction contributes to conversions. This approach provides more nuanced insights than ROAS alone and helps improve ad spend allocation across channels.
How to Set Realistic ROAS Goals
Business model considerations significantly impact appropriate ROAS targets. SaaS companies with recurring revenue models can often accept lower initial ROAS because customers provide ongoing value. E-commerce businesses typically need higher ROAS to account for inventory costs and one-time transactions.
Overhead costs must be factored into ROAS targets to ensure campaigns generate actual profit. Calculate your break-even ROAS by considering product costs, operational expenses, and desired profit margins. This analysis prevents you from celebrating false victories with seemingly good ROAS numbers that don’t contribute to business profitability.
Start with industry benchmarks as reference points, then adjust based on your specific business model, competitive environment, and growth objectives. New businesses might initially accept lower ROAS while building brand awareness, while established companies should target higher returns.
Tools and Platforms for Tracking ROAS
Google Analytics provides comprehensive ROAS tracking through goal setup and e-commerce tracking. Create custom reports and dashboards to monitor ROAS across different campaigns, channels, and time periods. Enhanced e-commerce tracking offers detailed insights into customer behavior and conversion paths.
Google Ads includes built-in ROAS tracking and automated bidding strategies designed to optimize for target ROAS goals. The platform’s conversion tracking and attribution modeling help businesses understand campaign performance and make data-driven optimization decisions.
Facebook Ads Manager offers detailed ROAS reporting and optimization tools specifically designed for the platform’s advertising ecosystem. Custom conversion tracking and lookalike audience creation help improve ROAS performance over time.
Most advertising platforms now include native ROAS tracking capabilities, making it easier to monitor performance across different channels. Third-party analytics tools can provide additional insights and cross-platform reporting for businesses using multiple advertising channels.
Frequently Asked Questions
What ROAS is considered profitable?
A profitable ROAS depends on your gross margin and business model. Generally, a ROAS above 400% is considered good for most businesses, but you need to calculate your break-even ROAS based on product costs and operational expenses.
How often should I check my ROAS?
Monitor ROAS daily for active campaigns to catch performance issues quickly. Weekly analysis helps identify trends, while monthly reviews provide insights for strategic adjustments. The frequency depends on your ad spend volume and campaign objectives.
Can ROAS be too high?
Yes, exceptionally high ROAS might indicate missed opportunities for scaling. If your ROAS is significantly above target, consider increasing your budget or expanding to new audiences to grow your business while maintaining profitability.
How do I improve low ROAS?
Start by analyzing your customer journey, improving ad targeting, testing new creative variations, and optimizing landing pages. Consider your attribution model and ensure you’re tracking all relevant conversions accurately.
Should I pause campaigns with low ROAS immediately?
Not necessarily. Consider the campaign’s learning phase, seasonal factors, and attribution delays before making decisions. Give campaigns time to optimize, but don’t let consistently poor performers drain your budget indefinitely.
Maximizing Your Advertising Investment
ROAS serves as a powerful tool for measuring advertising effectiveness, but it works best when combined with other metrics to provide comprehensive campaign insights. Understanding industry benchmarks, calculating your break-even point, and implementing optimization strategies will help you achieve sustainable advertising success.
Success with ROAS requires ongoing attention to campaign performance, continuous testing, and willingness to adjust strategies based on data insights. The most successful advertisers use ROAS as one component of a broader performance measurement framework that includes profitability, customer lifetime value, and business growth objectives.
Remember that good ROAS varies by industry, business model, and competitive landscape. Focus on understanding your specific situation, setting realistic targets, and implementing systematic optimization processes to improve performance over time.
Ready to implement these ROAS strategies and boost your advertising ROI? Start by calculating your current ROAS across all campaigns, identify your most profitable channels, and begin testing the optimization techniques outlined in this guide. Consider exploring our guide on [Optimizing Marketing Automation Workflows] to further enhance your marketing effectiveness.
Download our free ROAS calculator to easily track your ad performance, or contact our team for a consultation on optimizing your advertising campaigns for maximum profitability.
